archeoViz
Project Overview
This new partnership from the Center for Digital Antiquity provides tDAR GIS datasets to the archeoViz visualization tool.
Project Details
archeoViz offers interactive visualizations, can generate and export 3D view, cross sections and maps of the remains, can run basic spatial statistics methods (convex hull, regression surfaces, 2D kernel density estimation), export data to other online applications, and display the timeline of an excavation. tDAR has partnered with archeoViz to connect archived GIS datasets to this interactive web-application.
archeoViz, developed by Sébastien Plutniak, is designed for spatial data in archaeology generated during excavations and surveys. It allows to visualize a dataset, interactively explore it, and quickly deploy and communicate it on the web.
This app is distributed as an open source R package, with its code available on GitHub.
There are currently seven visualization connected to tDAR datasets, including:
- Barger Gulch
- Erb Tanks
- Kieler 1
- Kieler 1 block 3
- Morton County 0306
- Morton County 1374
- Morton County 1375
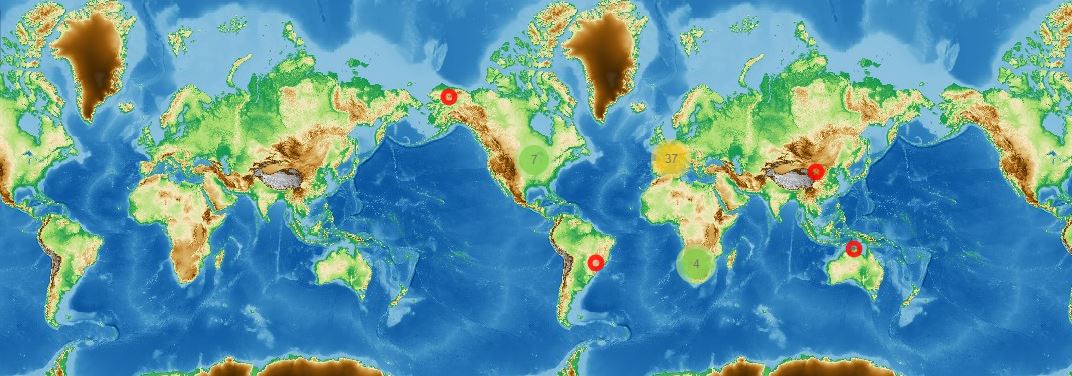
These archeoViz instances are referenced in the archeoViz Portal.
Thanks to tDAR giving unique identifiers to every lines of tables, points in the archeoViz visualisation are directly linked to their corresponding individual records in the tDAR datasets.
If you are interested in using archeoViz for your spatial dataset, please contact us at [email protected] and visit the archeoViz blog.
Partners: CNRS | Université de Tours
Research Team
Funding
No funding information available.
Outcomes
No outcomes currently available.